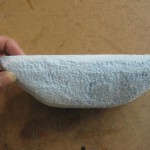
My concept for this assignment was to make a kitchen table that mimics the surface of water. It allows the diners and the items on the surface of the table to be equal partners in the interaction experience.
The PDF description is here and the OpenFrameworks zip file is here.
I also found an excellent Processing example of ripples, which perhaps in the next 5 years I’ll be able to translate into OpenFrameworks.
My final project for Physical Computing eventually ended up to be an MP3 player that encourages you to take care of your houseplant. This evolved from a previous idea of making a plant that is more like a pet than a plant. I changed my mind after getting some good feedback from my class when I presented my idea. One of their suggestions was to focus on the emotional aspect of how the plant makes you feel. They also advised that care of the plant needs to be an important aspect of the project.
This is how it works: Press the moisture test button. If the soil is dry, the plant will cry; otherwise, it will laugh. If the soil isn’t dry, you can use the MP3 player. You can advance forward and back through an array of music files. You can also pause the music.
Test Button
Not only do you care for your plant, it seems like your plant cares for you, too. Although the interface for this project ended up being dainty and pretty, I do admit that 90% of my time on this project seemed to really be spent on code and trying to get things to work. I’ve written about this project in previous posts, so I won’t recap what I’ve discussed in those. But, they’re here if you are interested in reading through them and understanding more about how the project was generated.
Because I wanted to embed the interactive mechanics inside the plant, I spent about 1 week on the wave shield and, while I did get it to work, in the end still couldn’t get it to work so well. Some of the issues I had with it were that I didn’t understand the documentation clearly, the code is in some C-language, and my SD card wasn’t formatted correctly. Eventually, I did get it to work, but by that time Minim was looking pretty good. So, sound was now going to be handled by Processing. I also tested out different motion detection sensors to see what types of results I could get that would fit my needs best. Some of the issues I had were that the sensors were too bulky to elegantly embed inside the plant or the serial data I got from the Arduino was too sensitive.
Meanwhile, I was also thinking about my ICM final and how I wanted to create something separate from my Phys Comp final. Originally, I wanted to make a radio that streamed internet radio stations. However, when I discussed this idea with more knowledgeable people and looked it up online, I got the impression that it would be very difficult to implement. So, I left that idea behind and went to my next idea, which was simply an MP3 player. Wanting to make something more interactive and pretty, I started looking up options for Processing and Minim, and what type of visual display I could make. I looked around for an “audio visualizer” on OpenProcessing.org and found this sketch to work with. After that, I spent a little bit of time everyday trying to figure out how the code worked and augmenting it bit by bit to create something new.
By now, it became obvious that I should just put the two projects together. Deciding to use Minim for my Physical Computing project was a huge relief. Not only was it easier to use and had documentation I could understand, it was also easier to get help since Minim is something that other people at ITP have actually worked with on a somewhat frequent basis. (It’s also in the book).
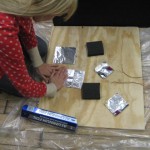
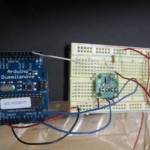
Plus, I could research more about Minim while I was away at a conference in London for a few days. When I got back the States, I went back to the prototype I’d set up before I left using FSRs as triggers for the playback buttons. The FSRs I switched out for exposed wires, because I really didn’t need the analog input values the FSRs provided. (Plus, I seem to have a tendency to destroy my FSRs.) What I really needed were simple HIGH and LOW values from a digital switch which I made out of small sheets of copper.
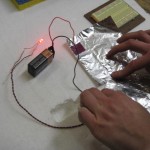
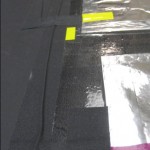
To test the soil for its resistance to electrical current, I made what could easily be called the simplest switch ever. Add 2 nails + 5V + ground to wet soil. Test for current. Actually, I learned how to do this from reading the internet, the blog of another student,and talking to yet another knowledgeable person.
As I understand, this switch works when the resistance of the soil changes enough to allow a current to flow more freely. At first, I tried this out with just a bowl of water, but I think maybe it shorted out (?) – you really need a plant or at least the soil to get this to work properly. I also added an LED for my own visual feedback.
So, now I had the buttons and the plant. Eventually, I also had a pretty nifty audio visualizer (which at the time of this writing, I may still try to improve upon). So, finally, I just had to assemble the pieces.
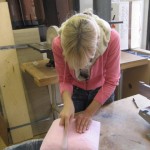
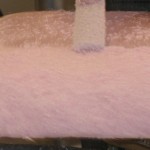
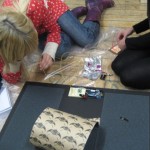
Pretty much I just found whatever I had lying around. I found a picture frame in the junk shelf and used that for the frame. I also had some pieces of cork lying around for a bulletin board I never put on my wall, and I used that to cover the frame and to be a backing for the buttons. The whole construction phase literally took just 1 day. Most of my issues with this project were with the code. Luckily there are more knowledgeablepeople around who can offer help with the code. It also made it a lot easier to test the switches when the wires were not stuck in a plant.
Now that I’m done with the simplest of functionality, to improve it here are a few things I could do:
Make a sturdier interface – use something other than cork
Label the buttons
Provide more feedback when a button is pressed, such as an LED
Make the hardware smaller – so that it could fit into other plants or could be portable
Make the hardware wireless – so it can work with your iTunes playlist or another array of music files; e.g., it would just give the go ahead that the plant is well watered and you can now play music
Use a larger array of sound files, such as from your computer’s music library or a specific playlist you’ve selected. The issue with this improvement is that Minim doesn’t seem to like audio files that are not .wav or .mp3
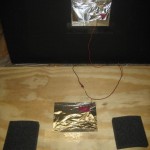
The way it works: User steps on the board, which completes a switch inside the board. An accelerometer inside the board reports back to Processing which way the user is leaning. Right – fast forward. Left – slow down. Tilt forward – screen gets darker. Tilt backward – screen lightens.
This week it got serious. We were using a bunch of Processing methods – if statements, loops and functions – which at the time was a big deal to me, since in practice I still didn’t really understand how to put it all together.
But, I found some residents to help me out and explain how things worked. They also introduced the ‘Switch’ statement, a more efficient ‘if’ statement, which later came in handy for my midterm project. So, while the finished product looks the same as last week, when you check out the code you’ll see that the two sketches are very different.
This week, I used the same concept from last week but I used variables to reduce the amount of code I was drawing. I also added an interactive element. Now, when you use your mouse to move left to right across the screen, the background changes from 255 (white) to 0 (black). The alpha level of each bar is still set manually, and choosing how much to decrease the level was somewhat mathematical but the level doesn’t decrease evenly. (This became a problem the next week when I used objects to create the sketch.) I like how it looks like there’s so much more to drawing the bars than just a change of alpha level.
In this week 1 exercise, my idea was to create a display of “swatches”, showing the color spectrum against a background of either white or black. I also created swatches of either white lines against the background of each color, and a final long series of stripes of white against no color, or black.
The whole thing was created in Processing. For the colors, I used the RGB values. It was a little difficult thinking of where each stripe would go, because I had to navigate using pixels. Pretty much, in the end I thought this was much like creating DIVs in CSS – but, less goofy. I cut and paste a lot, and experiment a bit trying to figure out which coordinates I should change when creating the new rows. The interesting part was that at one point I thought about reversing the colors, and did so in the code. However, since each rectangle’s location is specified by coordinates, the order doesn’t really matter. The order of the background’s does matter, because if it comes last, it would cover up the stripes. I guess the opacity of the backgrounds could be decreased so that some color shines through, but I’m just keeping the colors as they are.
I thought this was pretty fun, and useful perhaps in the future. I’ll give some credit to a fellow student, who suggested that I make the rows thinner than they originally were. Thank you, Nik!